Data Analysis & Visualisation
PROExplore a dataset and get findings, charts and the numbers behind them.
Analyse a dataset and produce findings with visualisations — descriptive statistics, distributions, correlation, trend/time-series, segmentation, and simple forecasting — outputting charts (as a Vega-Lite/Mermaid spec plus the underlying data table) and stating assumptions and limitations. Use when asked to analyse data, summarise a dataset, find trends or correlations, segment, or chart the numbers.
Ask for it in plain English, e.g.
Works in
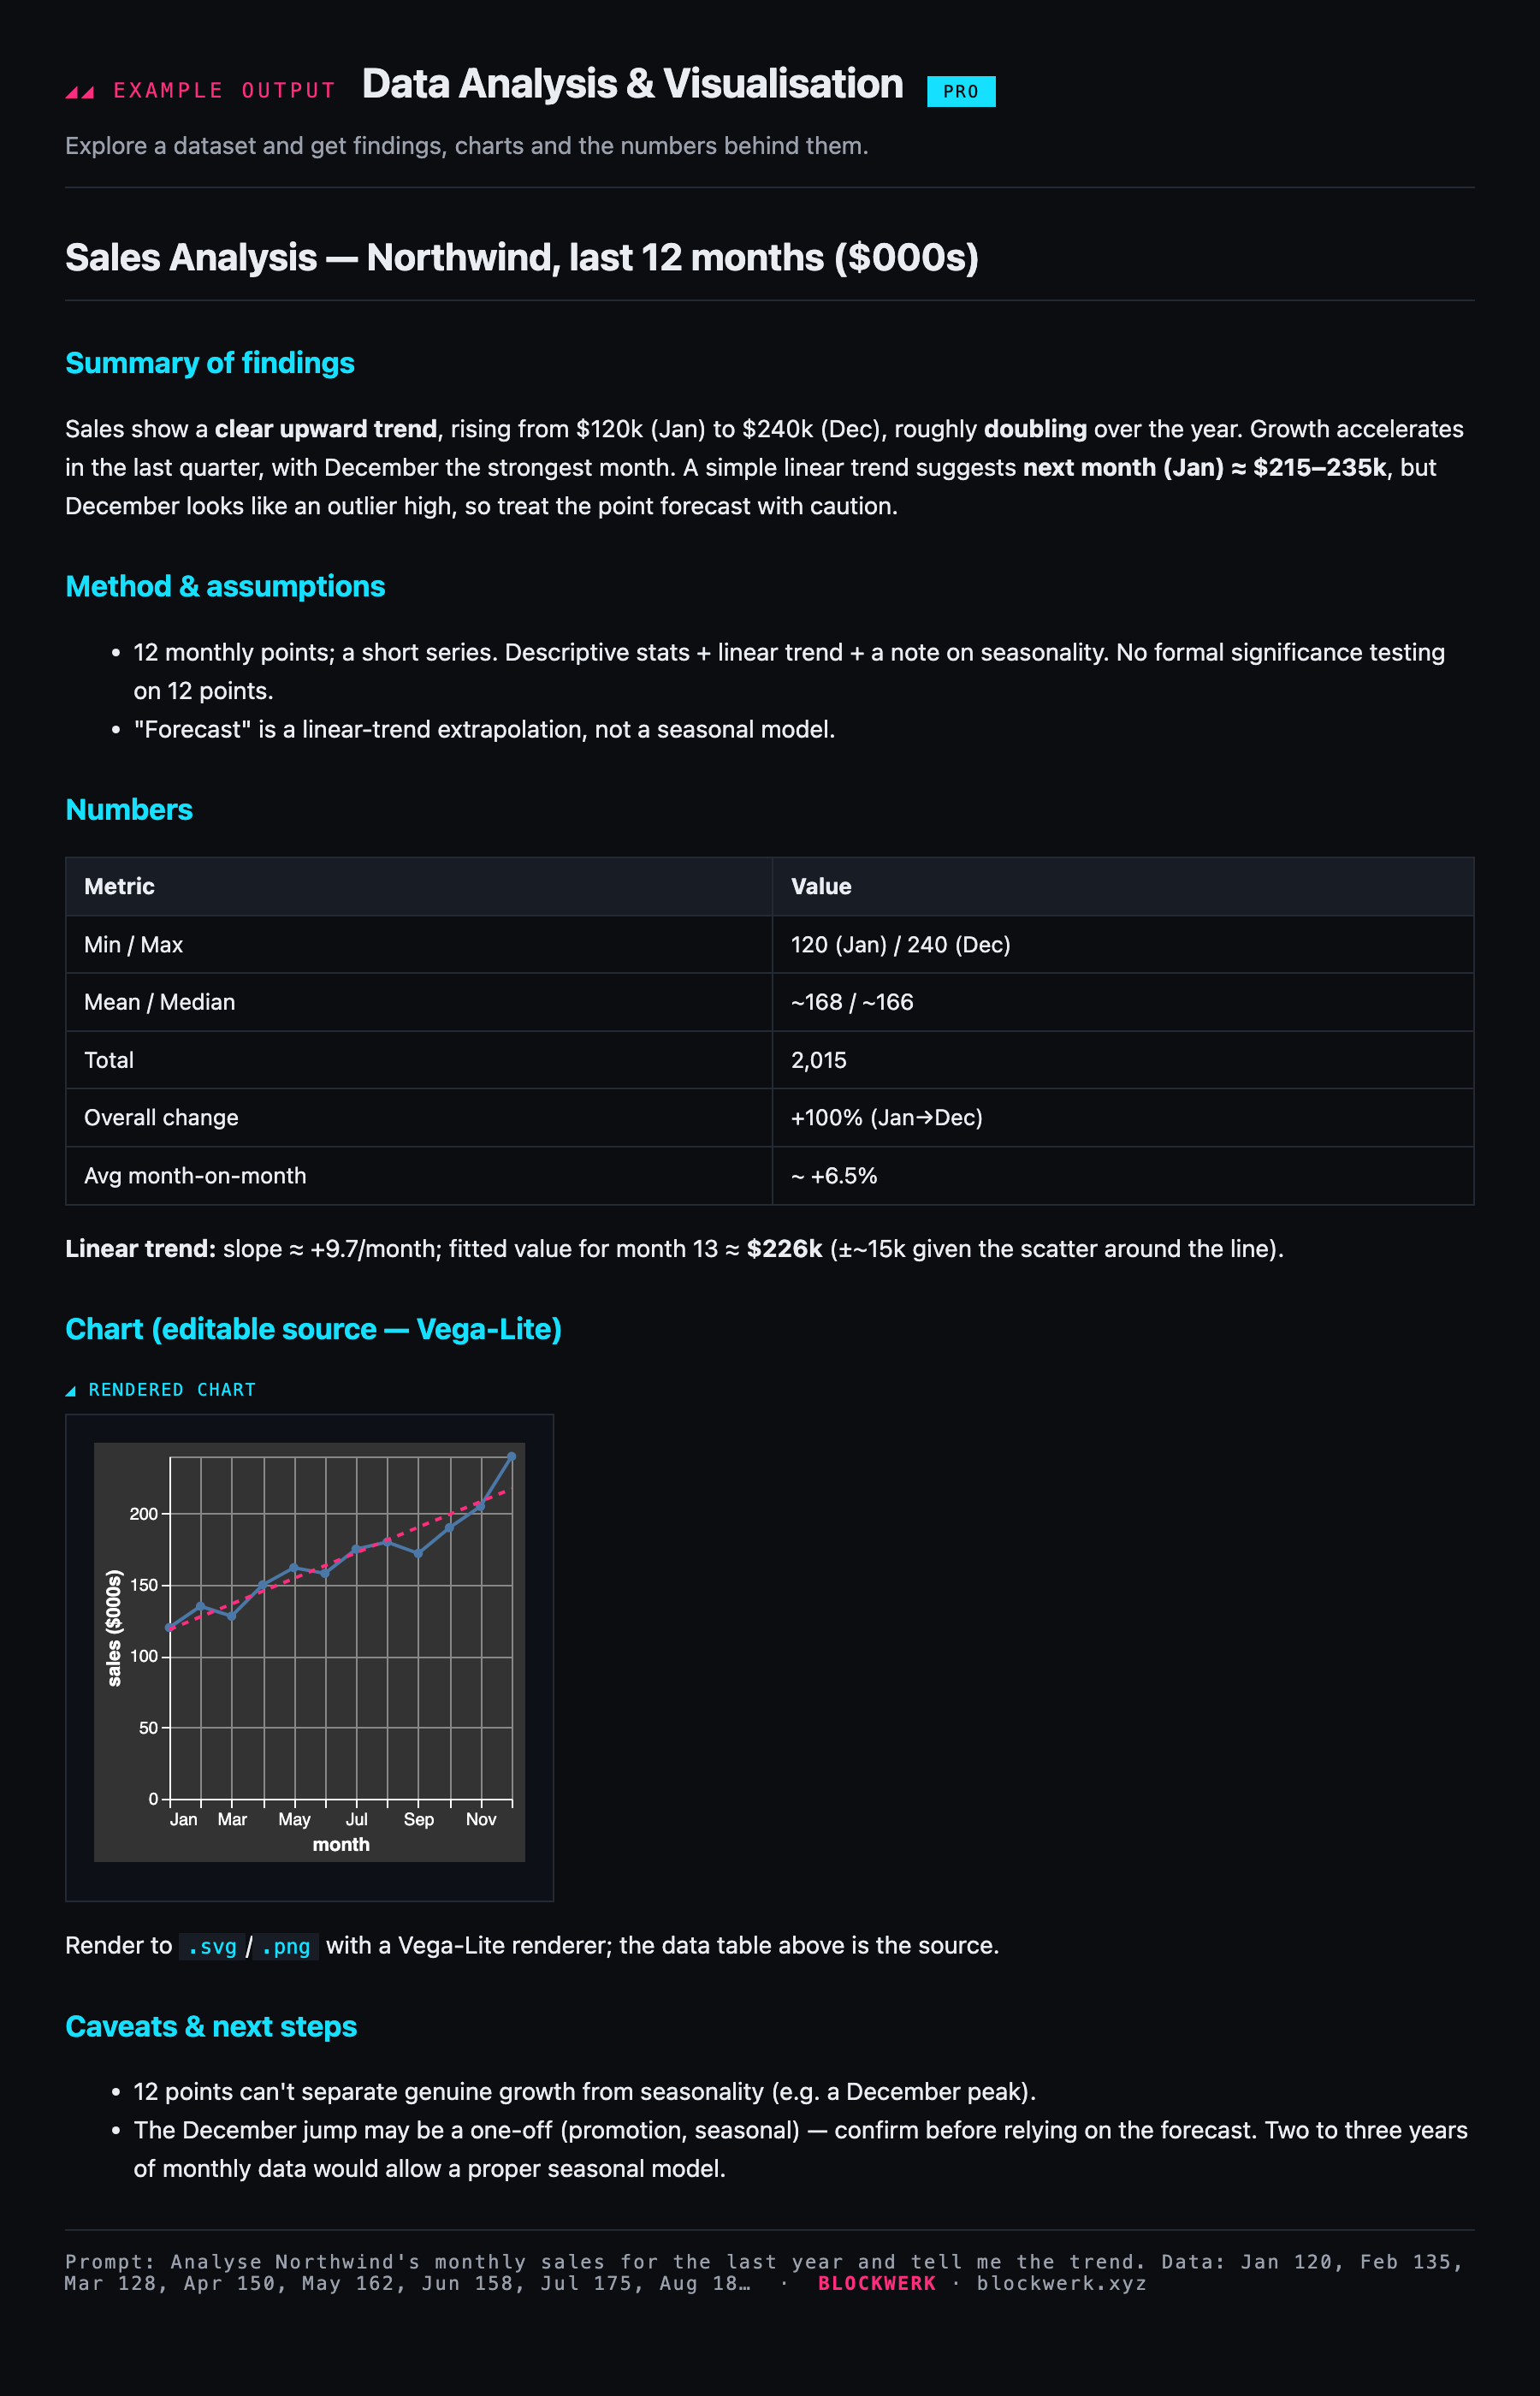
You ask: Analyse Northwind's monthly sales for the last year and tell me the trend. Data: Jan 120, Feb 135, Mar 128, Apr 150, May 162, Jun 158, Jul 175, Aug 180, Sep 172, Oct 190, Nov 205, Dec 240 (all in $000s). Is there a trend, and what might next month look like?
Example output shown for illustration. Your assistant produces this live from your own request once the skill is installed.