Deployment & Infrastructure Diagram
PROShow where everything runs — nodes, zones, and network paths.
Produce a deployment / infrastructure diagram — nodes, environments, network zones, and the components and data paths deployed across them — as editable Mermaid (or draw.io) following disciplined layout. Use when asked to draw a deployment diagram, an infrastructure diagram, a network/topology diagram, or show where components run.
Ask for it in plain English, e.g.
Works in
You ask: Draw a deployment diagram for Northwind's web app in production. Users hit a load balancer, which routes to web servers and an API, both running as containers. The API talks to a managed Postgres and a Redis cache. There's also a background worker. Everything's in a private network except the load balancer.
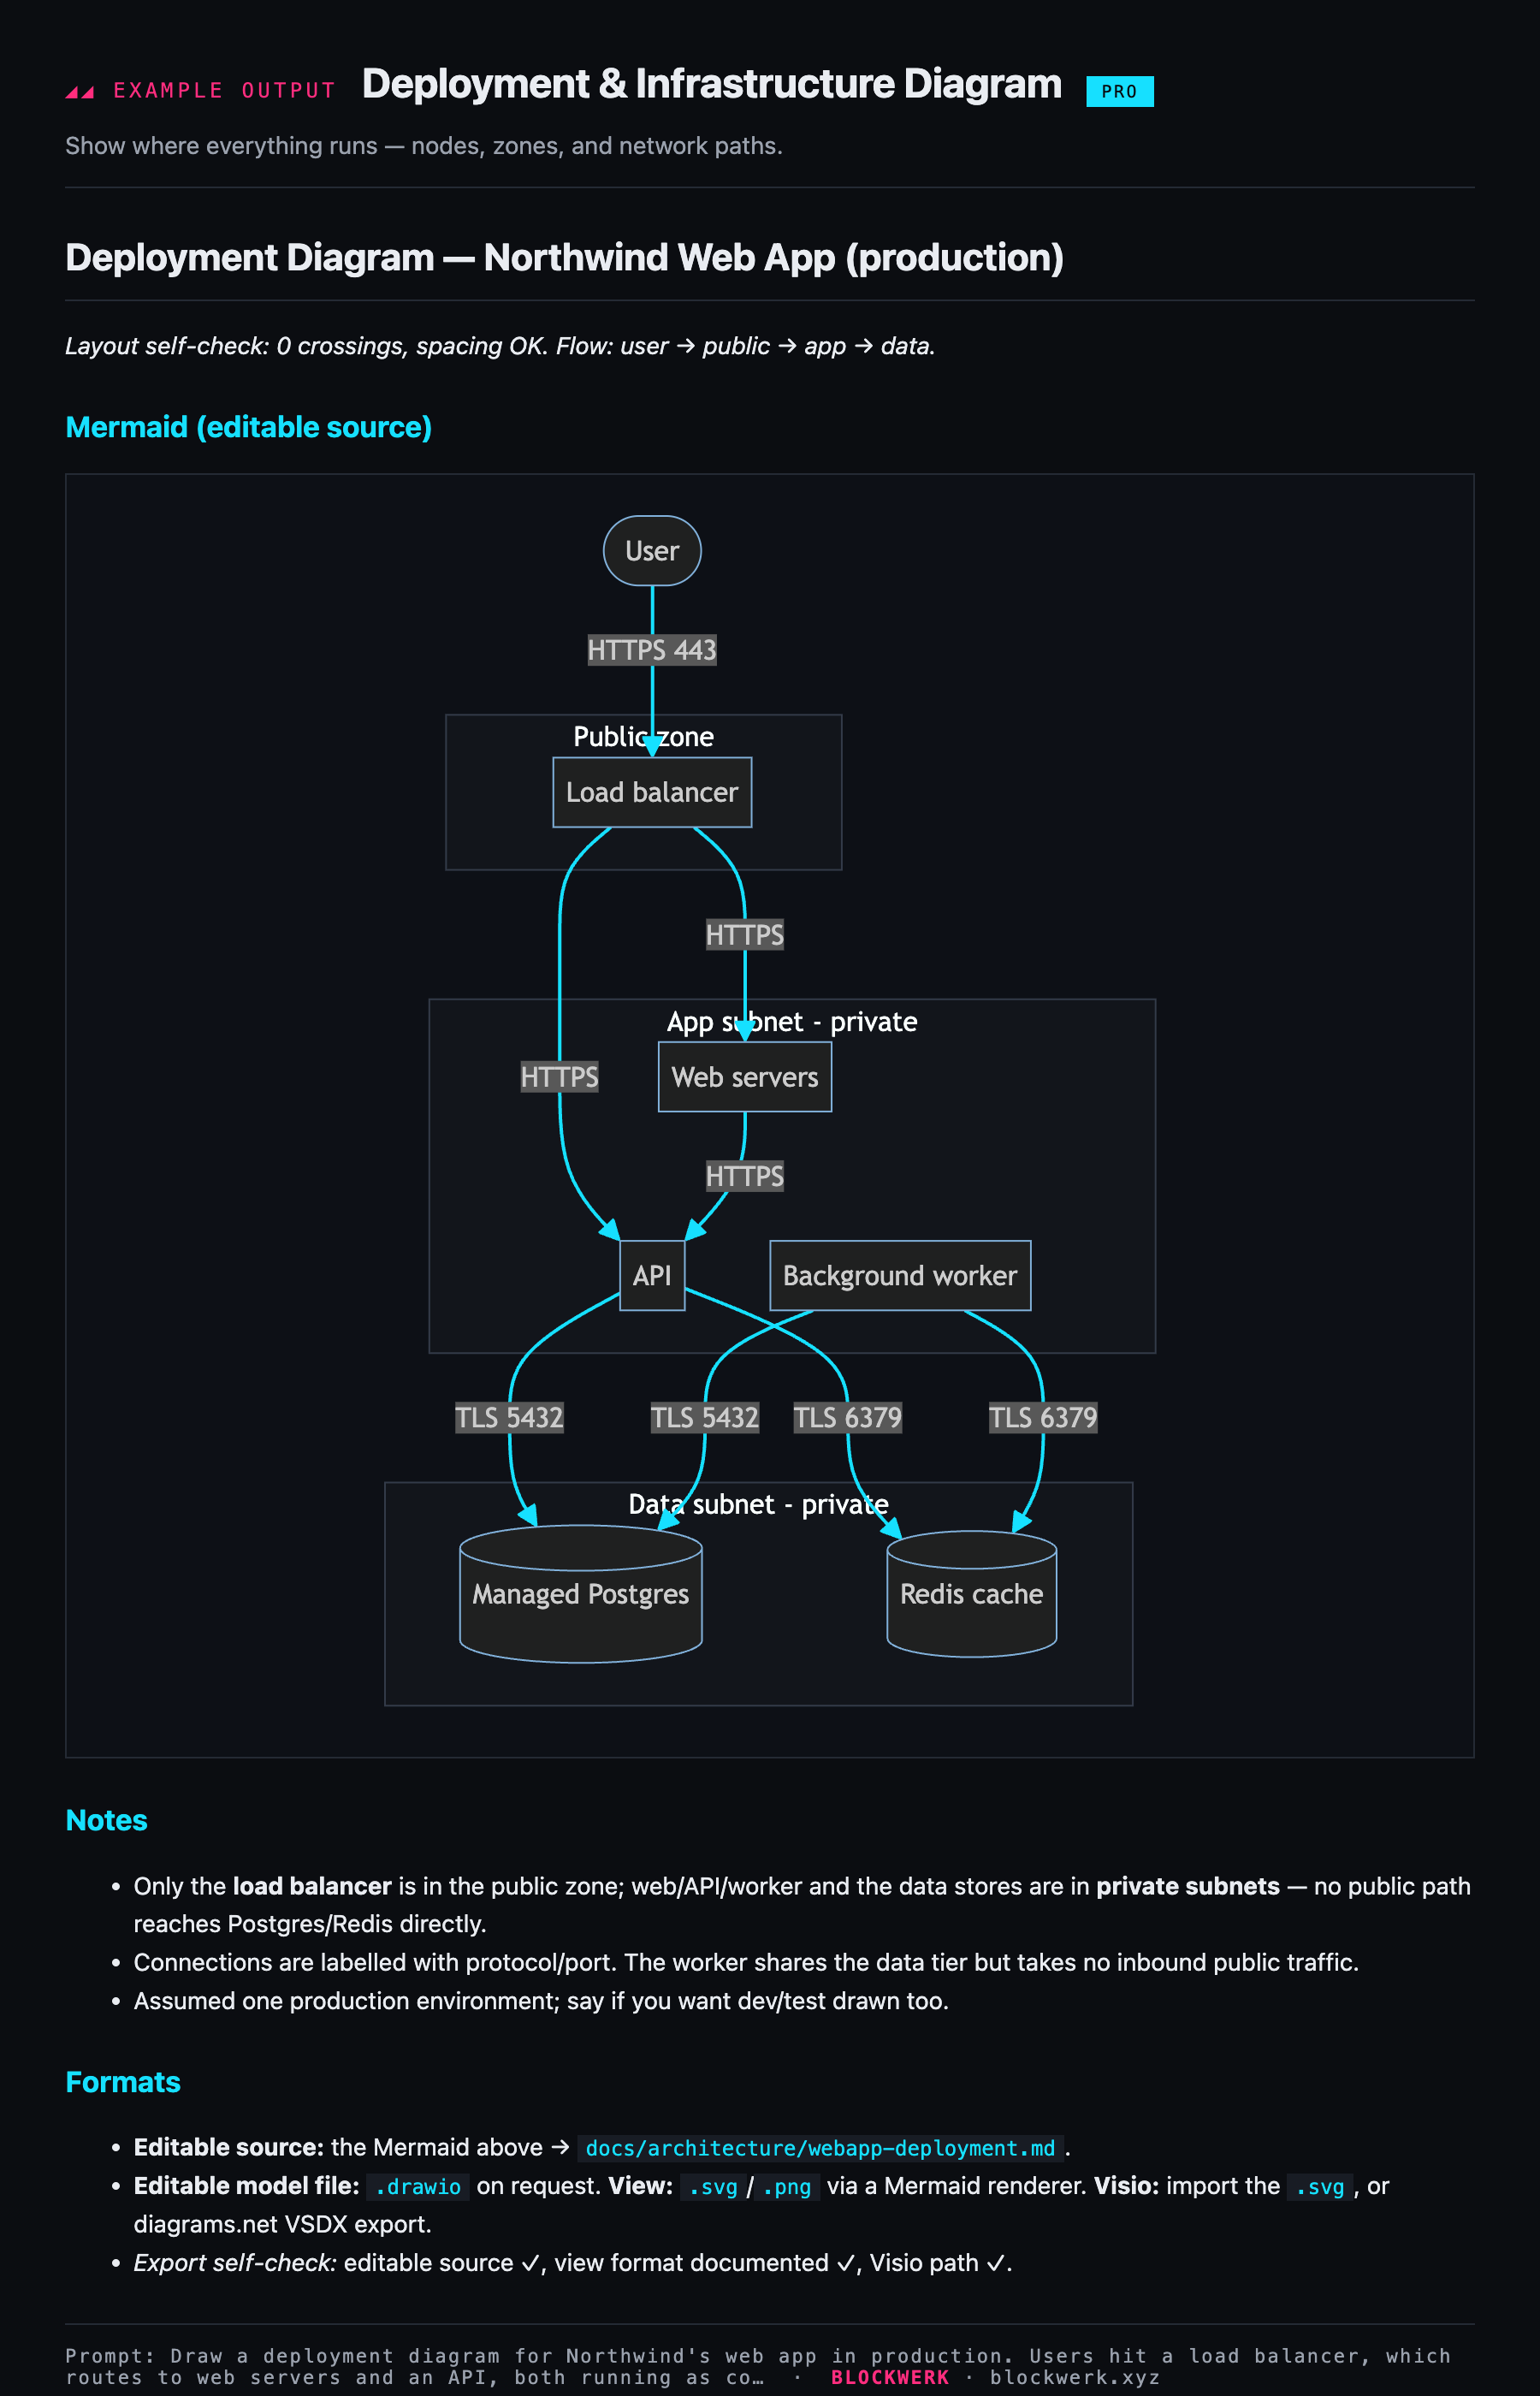
Example output shown for illustration. Your assistant produces this live from your own request once the skill is installed.